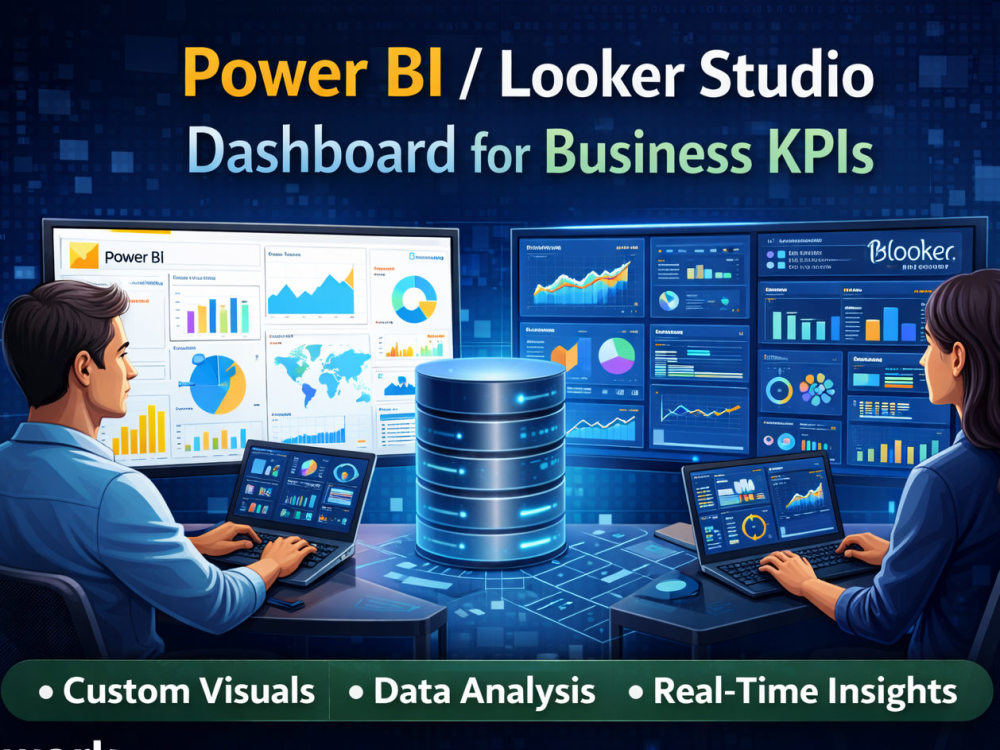
Power BI Dashboard for Finance, Sales & Operations KPIs
Project Overview
Your team is wasting hours building manual reports, or worse — making decisions without data. We’ll build you an interactive dashboard that connects to your data and gives you real-time visibility into the metrics that matter. At InferStack, we have developed Power BI dashboard that consolidates Finance, Sales, and Operations data to give management insight into the most important metrics in real-time. Instead of having to rely on reports generated from disparate systems, stakeholders now have a single source of truth that is always up to date. Message us with what metrics you need to track and I’ll mock up an approach within 24 hours.
Live Project
Confidential / InternalTech Stack
The Challenges
The client was previously using a combination of different spreadsheets and systems to track finance, sales, and operations data, resulting in time-consuming and error-prone reporting processes. Management was getting aggregated reports from different departments that provided no coherent view of the business’s financial health, and they struggled to identify areas of improvement since findings were often delayed. Stakeholders also wasted a lot of time manually compiling reports instead of focusing on more analytical tasks. In addition, the client needed an executive-level overview of the most important performance indicators so that they could make data-driven business decisions and monitor the company’s health in real-time. Finally, the organisation needed to identify opportunities for reducing costs and improving performance based on actionable insights derived from its data. We were engaged to resolve these issues and design a scalable Power BI reporting solution that would streamline financial reporting and provide management with timely analytical insights.
Our Solutions
InferStack consolidated all data sources into a unified Power BI dashboard, eliminating the need to switch between different spreadsheets and report generation tools while ensuring faster report generation and more reliable data. We structured the data so that stakeholders could monitor the most important Finance, Sales, and Operations metrics in one place and understand their interrelationship. Additionally, we were able to implement dashboards with drill-down capabilities that enabled users to follow from a high-level summary to the underlying details. Our solutions also included the ability to slice-and-dice the data according to different parameters and customize the dashboard to suit the needs of various departments. With this approach, we were able to ensure that each stakeholder viewed the most relevant data and that all financial metrics were available in real-time.
Core Features & Capabilities
Our solution included real-time KPI monitoring,
automated dashboards,
drill-down capabilities from summary-level to transaction-level data,
and filters to help stakeholders monitor key trends and make quicker business decisions.
We also provided different dashboard views to selected users depending on their departments and the data metrics they needed to focus on to drive performance improvements.
Lastly, we ensured that all dashboards were always up to date, thus eliminating the need for manual data updates.
The benefits of our solution included reduced reporting time due to the automation of the report generation process and the elimination of the need for data compilation.
The client also benefited from being able to track and monitor the most important performance indicators and make faster business decisions.
Finally, our solution provided a repeatable process that can be relied upon to scale as the business grows.
Measurable
Business Impact
The final product exceeded all initial KPIs, driving user engagement and streamlining operations for the client.
"Reporting time decreased significantly as there was no need to perform data compilation manually, while the executives obtained a more comprehensive and up-to-date view of the company’s performance rather than relying on delayed and disparate reports. In addition, the client was able to build a scalable solution using the Power BI dashboard created by InferStack, which would help monitor additional indicators as the business grew."