Dashboard Development
Custom interactive dashboards that transform your raw business data into clear, actionable insights — helping you make faster decisions with real-time visibility into sales, operations, and performance.
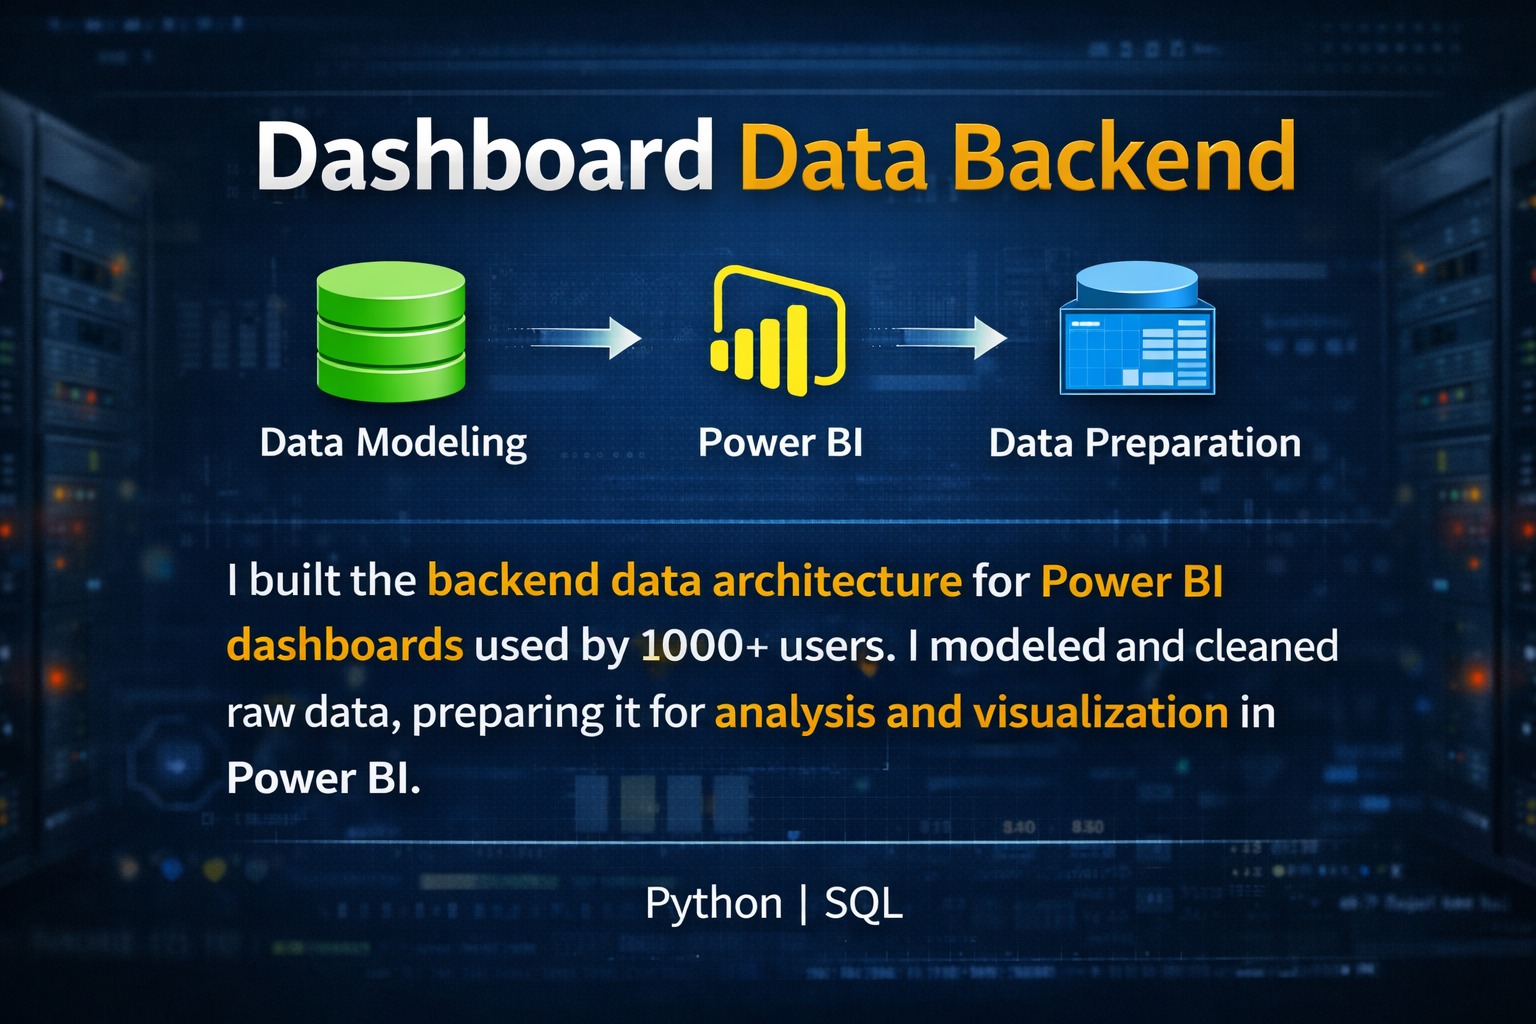
Delivering
Excellence
Grow with our
Enterprise-ready features
Real Time
Real-time data refresh from multiple sources (Excel, Google Sheets, SQL databases, APIs)
Mobile Friendly
Mobile-responsive dashboards accessible from anywhere
Automated Email and messages
Automated email/WhatsApp report scheduling
Our Process Model
A transparent, structured approach to success.
Discovery Call
Free 30-min consultation to understand your business, data sources, and KPIs you want to track
Requirements Document
Written scope with mockups, timeline, and fixed pricing in PKR
Data Audit
I review your existing data sources and flag any quality issues
Design
You approve dashboard layouts before development begins
Development
Connecting data sources, building visualizations, applying business logic
Support
Free bug fixes and minor tweaks post-launch
Features We Help Setup
Data Visualization
Charts & graphs (e.g., Tableau, Power BI)
Real-Time Data
Live updates
Simple UI/UX
Clean & easy to use
Custom Widgets
User personalization
Filters & Drill-Down
Detailed data view
Data Integration
Multiple data sources
KPIs
Key metrics display
Security
Login & role access
Export/Share
Reports & sharing
Alerts
Notifications on changes
Overview
Our Tech Stack
Get In Touch
Let's discuss how we can implement Dashboard Development for your business.